Mathematicians who want to save democracy!

Politics:
How math is used to evaluate districts to ensure all votes count

In 2018, there have been several court cases where a group of voters have claimed they have been disenfranchised–that their vote didn’t count.

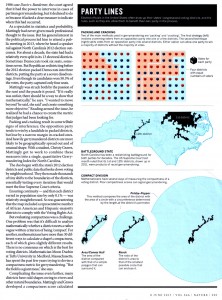
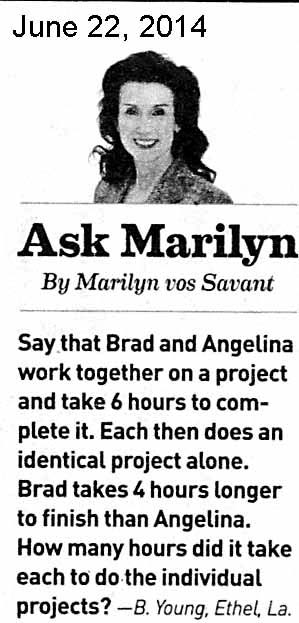
Text article as image

Click to read…

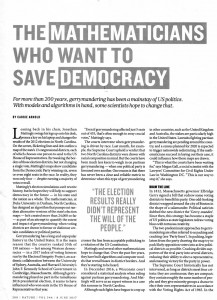
These cases are mostly brought by Democrats, who received a larger portion of the vote in a state, but placed fewer members in Congress or the state legislatures. This article (Nature, June 8, 2017) explains how math can be used to evaluate “fairness”, using objective measures that are easy to understand (e.g. such as comparing perimeters and areas of districts).

Activity: Use the internet to find details on these cases (choose one or more) and answer these questions:
1. How many “seats” were voted on?
2. Compare the party vote to the total vote, and calculate percentage of votes.
3. Compare the number of seats won to the total seats, and calculate the percentage of seats.
4. Discuss your sources (very important) and the results. As an example, here is a good article on the national level: Brookings Institute article on misrepresentation in Congress.

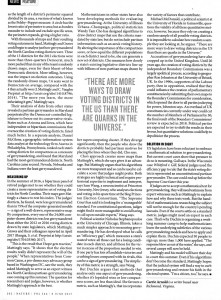
Here are pages 2 & 3 of the article from Nature, June 8th, 2017

Text article - image

Click for part 2.


text article - image

Click for part 3.

Posted in geometry, politics, statistics | Comments Off

Book Review: The Perfect Bet

“How science and math are taking the luck out of gambling”

by Adam Kucharski
(Basic Books 2016)

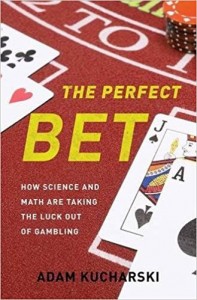
As a math major, I get a kick about the way gambling has been branded as the “Gaming Industry,” as if it were a productive activity for a successful society.  I don’t gamble because I know the odds. Most people sense that you really can’t win over the long term. The Perfect Bet book coverBut there are exceptions. Some have found ways to beat blackjack, roulette, lotteries, horse racing, online betting, and more. Mr. Kucharski does an excellent job of explaining how people have found these winning strategies, using probability data to identify deviations from randomness (e.g. a poorly crafted roulette wheel) and inaccurate odds that can be played for financial gain.

The author details many schemes dating back over 100 years. For example, in the 1890s, a Monaco newspaper published the results of a casino’s roulette spins—every spin—providing useful data to study the odds, right? Mathematician and statistical genius Karl Pearson was studying roulette wheel randomness and determined that the spin data was suspicious, because there were not enough “runs” of a color (e.g. 3 spins hit red numbers in a row). He was right. The reporters were just making it up the result. They only put effort in keeping the red/black ratio near 50%!

There are many more stories of systems and the people who discovered them. Modern systems tend toward computer based analysis—none seem particularly easy, but require significant work and time to exploit. Then, if you do find a system for winning, the casinos (or other venues) will lawfully ban you from gambling, as Edward Thorp, the “father of card counting” in the early 1960s, was banned from Las Vegas blackjack tables, and resorted to wearing disguises to sneak in.

There is a thorough reference section and index. My only suggestion for improvement would be to use more graphics. I highly recommend this book for curious gamblers, students, and those teaching statistics.

Teachers:
A good activity for statistics students might be to present, with graphics, a summary of how a particular gambling system worked, and how some of these methods resulted in game rules changing, such as adding cards to the blackjack “deck.”

Posted in gambling, statistics | Tagged , , | Comments Off

Work Problems in Algebra

The problem. Click for her solution.

The problem. Click for her solution.

In June 2014, Parade Magazine featured columnist Marilyn vos Savant  presented a classic work problem. Then she described her solution–which was totally wrong (Link to solution). Apparently I wasn’t the only one to catch her error.

Several weeks later, she posted a “correction”. Unfortunately, she still failed to clearly present the solution. This was a classic first year algebra problem. Unlike many problems that are set up to have rather easy answers, this one could only be solved by using the quadratic equation.

The Correct Solution

Marilyn’s approach goes wrong when she states that they work “12 man hours” based on 2 people working a total of 6 hrs. Brad and Angelina don’t work at the same rate!

Work done =(rate of work) x (time worked)
You can make 2 equations:
Say Brad works at the rate of “B” projects per hour,
and Angie works “A” projects/hr. so:
6A + 6B = 1 (working together to complete one project)

Separately, Angie takes “t” to complete, and Brad takes (t+4). Their rates are A=1/t and B=1/(t+4), so the first equation can be re-written as:
6 (1/t) + 6 (1/t+4) = 1
Now you solve for t (t^2 is “t squared”):
t^2-8t-24=0
Use the quadratic equation, and you get:
t=10.32 hours for Angeline; t+4=14.32 hours for Brad

Marilyn’s Correction
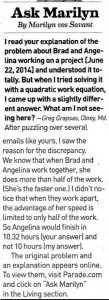
Click for larger image.

Click for larger image.

This was her followup attempt to correct the first wrong answer. I think it’s very poorly done!

Based on her murky “correction”, I posted the following comments on her website (http://parade.condenast.com/308009/marilynvossavant/308009/#comments)

Marilyn’s “correction” (7/13 issue) was very disappointing and weak. It could have been a teachable moment:
1. Always check your answers before publishing.
2. Some problems require rigorous, methodical math to solve, and there are not always “tricks” that you can use to avoid such math.
3. Math is powerful and you don’t need to be a genius to learn it.
4. Algebra is a more powerful tool than arithmetic.
5. Explain what a man-hour really means (she clearly didn’t understand this, nor admit that she didn’t).
6. Ask other people to check your work with a “fresh set of eyes.”

Instead of showing the actual solution, she makes this statement that really doesn’t help much:
“I didn’t notice that when they work apart, the advantage of her speed is limited to only half of the work.” WHAT? HUH??

This is first year algebra, and though many (most?) readers might not understand it, the real solution should have been posted–not just “10.32 hrs. That would have been a great illustration for math teachers to show their students that they can do something the “genius lady” couldn’t do.

Posted in Uncategorized | Tagged , , | Comments Off

Real World Math #1

The Good Ole Days!

Using math in the “real world” is an essential skill for success in life. Even if you inherit a ton of money, you still need to manage it. Standard topics include interest and returns on investments, taxes, and other financial matters. When you tackle “money math”, problems typically involve extended lengths of time–30 yr. mortgages, 10 year savings, etc.

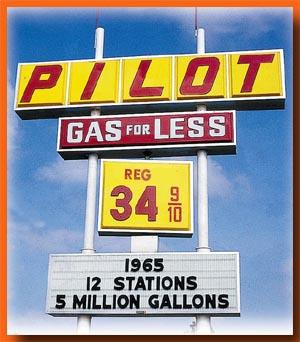
35 cent gas sign, 1965

Wow! Fill ‘er up!!

Inflation (and deflation) make dollar amounts “time sensitive”. For example, in the mid-1960s, gasoline was about 35 cents per gallon. Now we pay about $3.50 per gallon. So what does this mean in terms of purchasing power and wages over 50+ years? In 1965, $10,000 was a middle class salary. That’s about $5 per hour. But now, due to inflation, this is not even minimum wage! Here is a website that provides tools to calculate these values using hard statistics.

http://www.measuringworth.com/ppowerus/

So, for gasoline, in 1965, let’s use $3.50 for 10 gallons.
From the website: In 2012, the relative worth of $3.50 from 1965 is:

$25.50 using the Consumer Price Index
$19.60 using the GDP deflator
$26.80 using the value of consumer bundle
$26.90 using the unskilled wage
$31.70 using the Production Worker Compensation

So in 2012, $25.50 could buy about 7.3 gallons of gas, for the equivalent value of $3.50 in 1965. Two things are obvious:
1. You must adjust for changes in value over time.
2. Our gasoline is a bit more expensive, for sure, but nothing line “ten times as expensive” that you might first think!

Here are a few suggestions for using the calculation tools. First, pick a series of years you’re interested in. Then pick several intervals (e.g. 5 or 10 years at a time).

1. Compare the price of 1 ounce of gold.
2. How do the prices compare for a Corvette? You won’t find Corvette prices…you’ll have to search the net for old ads, etc.
3. Compare the price of food and other commodities.

Posted in Uncategorized | Leave a comment

Book Review: The Signal and the Noise

The Signal and the Noise, by Nate Silver, is an excellent book on statistics. After he successfully predicted 50 of 50 states correctly in the 2012 Presidential Election, interest in his book has exploded.
Who should read this book?
Mr. Silver writes about a variety of topics and their connection to statistics. If you are interested in weather,climate, and earthquake predictions, poker, the stock market, sports and sports-related gambling, or computerized chess, this book is for you. You will probably see things in a different way. You may also become frustrated at the way the mainstream media covers these areas!

The main weakness is the way Mr. Silver presents Bayesian statistics. The tables of x, y, and z seem to make the concept more difficult, and his initial example, using a “cheating spouse” scenario is the lowpoint of this otherwise excellent book.

Posted in Uncategorized | Leave a comment

“Love of Math”

Welcome to the MathAmore Blog.

Posted in Uncategorized | Leave a comment